Showing posts with label Geography. Show all posts

Saturday, 9 May 2015

Geography World Cities Revision Questions

Geography revision questions
  1. Describe global distribution of millionaire cities.
A millionaire city is a city with over 1 million inhabitants. The highest number of millionaire cities are located in developing countries due to globalisation, especially in the Far East but also found in MEDCs. A lot are found at places where work is so people move there to work and live
  1. Distinguish between mega cities and world cities, give examples of each
A mega city is a city with over 10 million people like Delhi. A world city is a city that acts as a global hub for finance, trade, culture business etc. like London or New York.
  1. Describe and comment on the changing population sizes of megacities shown in the table
Table? Growth of megacities is mainly in developing countries where the population is increasing quickly. MEDC’s megacities are not growing as quickly as the megacities in LEDCs.
  1. Rates of urbanisation increase as levels of development increase. To what extent is this statement true?
Not entirely. There has been an overall increase in urbanisation as there has been a revolution in farming practices and increase in technology has meant that more people are moving to cities in order to find work. This is evident in LEDCs however in MEDCs there is clear evidence of counter urbanisation where people are moving out of the city centre due to factors such as congestion and reduced living standards.
  1. Define.
Urbanisation – the movement of people to an urban area from a rural area. Suburbanisation is the growth of people living on the fringes of a city/suburb. Counter urbanisation is the movement of people from an urban area to a rural area.
  1. Why has a named city grown in size?
Sao Paulo is in South America and is located near Rio and Curitiba. Until the 18th century sao Paulo was not considered an important city. However the emergence of the coffee industry and gold mining in Sao Paulo brought European culture. However after the coffee industry died down people started businesses there. In the 20th century Brazil became a republic allowing Sao Paulo to have political power.
  1. For named case study, describe effects of urbanisation on character of city
It is a city of contrasts with some areas being very wealthy and other areas living in slum-like conditions. The population has seen a huge increase in recent years. Starting in 1940 the pop was below 2 million and now it is nearing 12 million people. Due to the pull factors of work and city lifestyle it has become hugely overcrowded and resulted in the growth of slums due to urban sprawl. Between 980 and 1990 the population living in favelas increased 120%. There are redevelopment schemes such as the Cingapura scheme that aims to cut down favelas and build tower blocks. Now 20% of people live in favelas. The city is incredibly overcrowded and busty therefore the rich have decided to invest in helicopters making Sao Paulo the second most popular area for helicopters.
  1. How are the effects of urbanisation being managed by the area

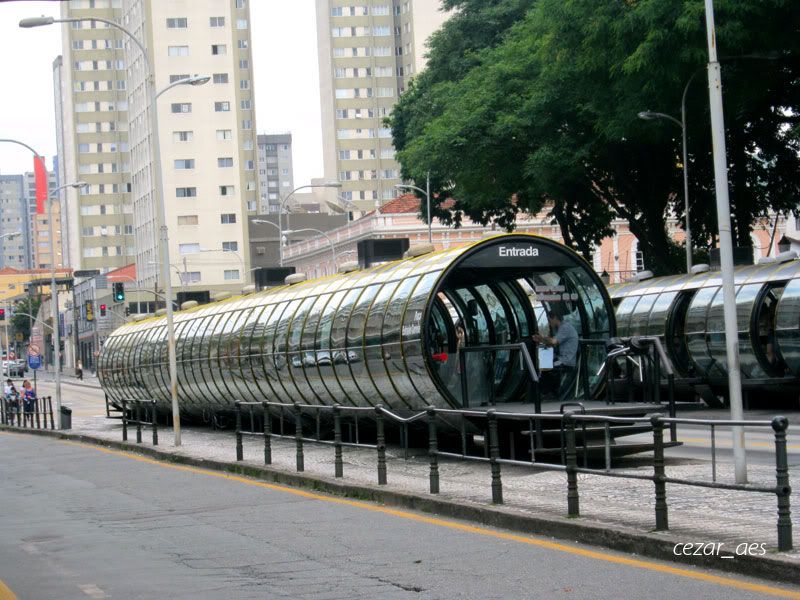
The Cingapura scheme aims to tackle the favelas by knocking them down and building tower blocks In order to improve their standard of living however tower blocks take away the community atmosphere and are not popular. In order to improve the transport there is an underground metro system to reduce pollution of cars, reuce congestion etc.

Riders For Health Kenya - Geog4B Human capacity

How increasing human capacity will help Kenya move towards achieving the MDGs.
Introduction
  • Human capacity is the stock of knowledge, habits and social attributes, which create the ability to perform labour so that the economic development can occur.
  • These resources are the total capacity of the people that represents a form of wealth which can be directed to accomplish the goals of the nation.
  • The MDGs (Millennium development goals) are 8 international goals that were established to promote development.  They emphasise three areas, human capital, infrastructure and human rights.
  • Human capital objectives include nutrition, healthcare (including child mortality, HIV/AIDS, tuberculosis and malaria, and reproductive health) and education.


  1. Increasing the number of health care workers
  • This increases the workforce and so allows knowledge to be gained and skills.
  • Rotating expat programme
Medical staff from LEDC to UK
Medical staff from MEDC to Kenya
Able to learn new skills that they can transfer to home country which will increase the knowledge of the locals.
Can give support and more experience to the medical staff and so increasing their knowledge and may change their usual medical habits to more effective once.
Able to use the latest technology and so learn how to deal with new unpredictable situations
Could provide new resources such as drugs to help reduce the spread of preventable diseases.
The new situations may not relate to the situation back home. For example they are unlikely to see diseases such as malaria in the UK
Might become overwhelmed with the situation as it will be nothing like the usual MEDC hospital. This could distract them and so not help the LEDC as much as planned.
A Brain drain may occur as all the brightest medical staff would leave Kenya. This would be Kenya would have to survive on a body of medical staff that are less skilled.
The issues may not be all textbook issues and so may not actually have the knowledge to give about the situations. The different circumstances mean they would have to deal with a situation differently to how they would at home.
Could be a language barrier and so medical staff might not be able to work as effectively


  • 2003 - doctors per 100,000 = 15 2007 - doctors per 100,000 = 18
  • By having more medical staff, people in more rural areas could be reached and so would help all the human capacity goals. Around 60% of the population live in rural locations which are hard to get to and the people live to difficult conditions. The staff could work with NGOs such as riders for health to make the care for accessible.
  • More people can be treated as there are more people who can treat them. This helps treat diseases and the spread of diseases.  


  1. Increased spending on education


  • Increasing human capital usually means increasing spending on education. If you are improving spending on education or making education more available you are increasing the human capital. As well as improving on MDG 2, primary universal education you are increasing the long term supply of the country. By having more productive workers you are able to create more wealth in the economy and therefore increase the money needed for investment. This investment can be used to help achieve all 8 MDGs. However there is an opportunity cost of spending on education ie. Money can be spent on infrastructure. There is also a considerable time lag between when the money is invested in education and when you reap the rewards.


  1. Increased wages resulting from more skills


  • The increase in wages and wealth in the economy will bring people out of poverty. If you have more skills due to education or training then you are able to demand higher wages and thus bringing yourself out of poverty. This directly help with MDG number 1: eradicating extreme poverty and hunger. These increased wages can spur on the multiplier effect and help bring others out of poverty.


  1. Increasing skilled workers – training –education – population will gain knowledge of treating and preventing
  • By providing training it increases the human capacity hugely. This is because people gain knowledge and understanding which allows them to help combat the MDGs. By increasing the amount of trained worker people can gain better incomes which would help with other goals such as eradicating extreme hunger and poverty. They would gain higher wages and so create more disposable income and have a better quality of life.
  • Able to spread knowledge of prevention and awareness
  • Help all three human capacity goals
  • The transfer of skills to other people means that people will become more experienced and so be able to treat more situations. They could learn how to reduce the risk of HIV/AIDS, malaria, and other diseases. This would create a stronger working population as the workers would be healthier and so would also help towards other MDGs.


Conclusion
  • In conclusion, the investment from the higher wealth gained from the increase in skills is the most important factor for developing and therefore achieving the MDG goals.
  • Even if there was developed infrastructure it is useless if the people cannot use it effectively and to the benefit of the country therefore increasing human capacity is vital for developing.
  • Health is one of the biggest barrier to developing and therefore overcoming it by improving skills and human capacity is sustainable way of growing and developing and ultimately achieving the MDGs.


Wednesday, 29 April 2015

Curitiba Case Study - Sustainable City


Curitiba is in Brazil and is recognized as one of the most sustainable cities in the world. It is in east Brazil and has a population of 1.8 million.


Started in 1970 when a team led by Jaime Lerner devised a plan to incorporate ecology, efficient transport, user friendly open spaces along with other goals.


Key aspects of Curitiba include:
  • Very efficient bus system where lanes are designated for buses to make journeys quicker and there is a 5 pronged star shape road network to increase efficiency. The bus is cheap (single priced ticket system) and makes travelling quick and easy. 75% of commuters take the buses and this results in 25% less congestion and 30% reduction in fuel consumption.
  • Encourage recycling and have a green swap system, this encourages people to walk to a local recycling point where they can swap their waste for bus tickets, food etc. 2/3 of the city's waste is now recycled. The program is voluntary but 70% of households participate.
  • There is a lot of open space (28 parks) and pedestrianization which increases the stand of living and also the environment. 52 square metres of green space per person. Builders are encouraged to crate green areas with their buildings by being given tax breaks.
  • Encourages non-polluting and hi-tech industries has been successful in achieving growth, avg growth rate of 7.1% (national average of 4.2%). There is high wealth in Curitiba with 66% higher per capita incomes than the Brazil average.

Saturday, 25 April 2015

The Growth Of China

China Today...
Second largest economy in the world GDP= $9.24 trillion
worlds fastest growing major economy (however in 2014 suffered slowest growth for 24 years, still 7.2%)
Second largest trading nation and largest exporter of goods
Since 1978 the average income has x4
during last 10 years has contribute more than 30% to global economy
Attracts most FDI in the world

How did it get there?
China's rapid growth started when it switched from a centrally planned economy to a more market orientated economy in 1978 under Deng Xioping. This opened up China to all sorts of opportunities. TNCs started to use the country an an export platform which made it a major competitor on that field to the Asian Tigers.
FDI was initially encouraged in SEZs (small enterprise zones) which were situated along the coast. In early 1980s the number of SEZs was expanded to a total of 17 (14 coastal, 3 inland). These SEZs were areas that had separate, more relaxed regulations and improved infrastructure in order to attract FDI. Shanghai is an example of an SEZ.
China joined the WTO in 2001 which allowed it greater access onto the global market.
China had competitive advantages due to their large population, cheap labour force and their ability to push policies through quickly.


However this growth caused many problems...
There have been massive disparities in incomes creating huge inequality. Areas are being left behind such as Suchuan and many rural areas.
Rapid industialization has caused major pollution in the form of smog and polluted waters (31/52 of the major lakes have severe pollution). Acid rain falls on 30% China.

Friday, 24 April 2015

Economic Vs Environmental Sustainability

Sustainability has 3 pillars:


Environmental - preserving needs of today without compromising needs of future. Involves protecting biodiversity and reducing pollution


Economic - using resources in an optimal way that can be achieved over the long term. Involves access to money, no corruption etc.


Social - a social system that operates in a way of keeping a level of wellbeing that can be sustained in the future Involves freedom of speech and access to healthcare and education.


The common problem faced is that as countries develop and industrialize they consume more and more natural resources are used up. This is happening at rate which is not sustainable. The challenge faced is that western consumption needs to be curbed and we increasing the standard of living in developing countries without increasing environmental impact or resource use.
Traditionally countries have developed at expense of environment. However according to the Kuznets curve a country gets to a stage where in order to increase GDP per capita further it needs to improve the environment. This could be due to the increased wealth and developed society are more aware of the environment. German economist Karl-Heinze Paque says that 'environmental protection comes from affluence'.


ESI was the original indicator of environmental sustainable development. It was in place from 1999 to 2005, it had 21 indicators and Finland topped the ESI with 75.1,
Since 205 the ESI has been replaced with the EPI which ranks countries and focuses more on outcome indicators. Switzerland top the EPI followed by Luxembourg. Note that the top 10 on the EPI are developed countries this backs up the statement from Paque.


So the real problem lies with the 2/3 of the population living in developing countries who need to improve the quality of life without destroying the environment by using up resources or impacting the environment too heavily. We need to live within our limits.


An example of sustainable development is in the Galapagos islands who pursue sustainable tourism. See ecotourism post to see case study.


Another example of sustainable development is Curitiba in Brazil. See other post for case study.

Wednesday, 22 April 2015

WTO, IMF and the World Bank

WTO is the world trade organization and their role is to help trade flow freely.
  • only global organization dealing with the rules of trade between countries
  • goal is to help producers of goods, services, exporters and importers conduct their business
  • WTO agreements are signed by the large trading nations and are essentially binding contracts to keep trade policies within certain limits. ie. reduce protectionism by getting rid of tariffs or quotas.
  • established in 1995
  • 160 countries/members
World Bank is there to help developing countries.
  • source of financial and technical assistance to developing countries
  • aim is to reduce poverty and support development.
  • They have two main goals: 1. end extreme poverty by 2030 and 2. promote shared prosperity (promoting incomes of the bottom 40% of developing countries)
IMF is the international monetary fund and they help countries with stability and growth
  • 188 countries
  • working to secure financial stability, facilitate international trade, promote employment and sustainable eco. growth along with reducing poverty
  • independent organization that promotes monetary cooperation and exchange rate stability.

Tuesday, 21 April 2015

Riders For Health Kenya - Geog4B

Riders For Health is an NGO set up by Barry and Andrea Coleman alongside Randy Momola in 1996. The scheme trains mobilizes health workers in order to reach rural areas and cater for the healthcare needs. They do various things such as HIV testing to health education sessions. The healthcare workers are mobilized by motorbikes in which they are trained in maintaining therefore they can reach rural ares over tough terrain. R4H is in seven different African countries and was introduced into Kenya in 2002.

Kenya and R4H (brief of AIB)
(Page 3) Kenya's health profile looks like this

  • Population - 45 million
  • Life expectancy - 63 - up 3 in 4 years
  • IMR - 40.71/1000 - halved in 4 years
  • Maternal Mortality rate - 3.6/1000

(Page 4) R4H was set up as mentioned by Andrea, Barry and Randy. They registered that many bikes were being left unattended and not working due to simple problems such as a flat tyre. They saw the opportunity that if they could fix them up and get them running then more healthcare would be delivered especially in tough terrain rural area that 60% of Kenya live on. R4H was announced n NGO in 1996 and operate in 7 countries across Africa.

(Page 5) They began operations in 2002 and they have 8 staff who manage 77 vehicles. The R4H bases are in Kisumu (western) and Nairobi (central).

(Page 6) In 2011 a training academy was set up in order to help riders develop skills such as driving, maintaining and journey planning with their bikes. An extra 20,000 people across Kenya can be reached due to the R4H. This is mainly due to travel time being cut from 4 hours down to 1. and being able to reach 80KM away instead of only 20KM.

(Page 7) The terrain and relief in Kenya is very varied. The highest areas are in the south western areas on the borders with Uganda and Tanzania. Kisumu where the academy was set up is located here and has relief of over 1000m.

(Page 8) Precipitation is also highest in these south western areas, with places such as Kisumu getting 2000mm+ of rainfall a year. This coincides with the higher the land the more rain which makes the terrain more difficult.

(Page 9) Cropland is once again highest in southwestern area such as Kisumu, this could be due to the relief and weather. Agriculture and crops is the main contributor to the nations GDP. Therefore there will be many rural communities that require healthcare. If better healthcare, better productivity.

(Page 10) Once again the southwestern rural areas have the highest population density with 600+ people per square KM in Kisumu. The main trend of the south western areas are between 100-599 people per square km. These people will therefore need healthcare.

(Page 11) Once again this coincides with the density of poverty which is in this region is high, Kisumu has 200+ people living on less that $2 a day per square km. This has a direct correlation with the healthcare needed in these areas and why bikes are so important.

(Page 12) There are many issues in Kenya regarding logistics of healthcare. The goods are supplied by KEMSA who are not very efficient and don't meet the needs of the people. The supplies are taken from Mombasa (coast) to central Nairobi and then to outlying warehouses. However there is a problem when it comes to the amount distributed to each area, the amount is based on the proportion of population living there and not to the areas that need it most. The deliveries are by lorries that struggle with rough terrain. The poor communications infrastructure gives local people no chance of ordering supplies according to local needs. The poor transport infrastructure makes it slow and unreliable to whether the supplies will reach the needed places. To improve an IT system needs to be put in place which will adapt the system to who needs it most. The delivery f the drugs could also be improved by vehicles better suited to rough terrain (motorbikes or 4x4).
Spending in the government is currently focusing on increasing the numbers of healthcare professionals and not on improving the infrastructure. I think this is a problem as many of the workers are moving to better paid posts abroad, and therefore the government are spending on the symptom and not the cause. There is a clear shortage of trained staff nationally but especially in rural areas where the number of patients to doctors is much lower than in urban areas.

(Page 13) There is an idea called rotating expat program which is to attract and develop talent from across the globe to come to Kenya to practice and train others in medicine for up to 2 years. This would benefit both countries. This would increase the numbers of workers and hopefully with a similar programme move some of the workers from urban to rural areas.

(Page 14) Millenium development goals  are 8 goals set in 2000 to be achieved by 2015.

  1. eradicate hunger and poverty
  2. universal primary education
  3. gender eequality
  4. reduce IMR
  5. improve maternal health
  6. combat HIV/Aids and other diseases
  7. ensure environmental sustainability
  8. develop global partnership
In 2005 it was said that the country were unlikely to achieve any of the MDGs due to lack of resources. A plan was put in place to help achieve the goals and one of the sections was 'strengthening service delivery systems'. This clearly relates to R4H. It is clear that investment works best when it is within a clearly structured health service with long term priorities. The main components of a functioning health system includes:
  • human resources
  • infrastructure 
  • management capacity
Kenya has 500 hospitals, 611 health centres and 3310 sub centres. Each hospital has a raatio of 1:60000 people. Only 25% of Kenyans had access to  health facility within 8KM. 
Health expenditure in rural areas accounts for 30% of gov spending on health, whilst rural ares get 70%, yet only 20% live in urban areas...

(Page 15) Adding on from the report it stated:
  • lack of supplies caused poor quality of care
  • 10% of healthcare spending was on treatment of HIV
  • utilization of facilities is low and this is due to a high cost of healthcare. Healthcare is not always free on point of delivery in Kenya. 
The document summarizes and gives the following suggestions:
  • focus should be on improving the human capacity. Ie. more training and hiring, health workers and agricultural extension officers
  • 39% should go to operations and maintenance. ie. on provision of anti malaria drugs and mosquto nets
  • 19% should go towards investment in infrastructure
  • In medium term spending should be focused on adding human capital and improving infrastructure especially down trunk road.

TNC Case Study - Coca Cola


Transnational companies are huge companies that operate in more than one country. Stereotypically the HQ is in an MEDC while factories are in developing countries as TNC's like to exploit cheap labor and land to maximize profits.


Coca Cola is the biggest manufacturer of drinks in the world. HQ is in Atlanta, America. &0% of it sales are from outside the USA. They don't only sell drinks but sell nearly 400 different products in more than 200 countries.


Positives of Coca Cola on host countries such as Russia:
  • creates jobs
  • offer training and education
  • has invested $1.5 billion in Russian economy
  • run community schemes
Negative of CC in host countries:
  • low paid jobs in tough conditions
  • footloose capitalism - when wages rise they move operations to a lower cost area
  • environmental problems ie. degradation
  • profits are returned to source country
  • to date there have been 179 human rights violations of workers


There are many advantages to being a TNC:
  • monopoly power
  • access to larger markets
  • economies of scale
  • offered incentives to invest in certain countries


LDC - Uganda Case Study

An LDC is defined as a lesser developed economy. They are a grouping of nations that are most impoverished and vulnerable. They follow 3 criteria:
  1. low income - under $750 GNI per capita
  2. Low human capital - low levels of nutrition, health and education
  3. economic vulnerability - instability of agriculture, imports and exports etc.
Uganda:

  • Very reliant on exports of coffee and tea so very risky as commodity prices vary greatly so risky for economy.
  • Huge debt from spending on weapons due to military regime in 1970.
  • High IMR: 85/1000
  • 75% of population without electricity
  • GDP per capita only $571 (under $750 to qualify as LDC)


How are Uganda trying to develop:

  • focusing on developing infrastructure. communications and roads etc.
  • service sector jobs are developing in Kampala (capital)
  • wildlife parks are starting to bring in money from tourism


Monday, 20 April 2015

Aid Case Studies - Haiti, Akosombo Dam and Farm Africa

Aid given to Haiti following the disastrous 7.0 earthquake in 2010 was an example of short term aid. Aid given following an event or natural disaster.
  • Haiti is the poorest country in the Western hemisphere and has the highest incidence of aid outside of Africa
  • It was estimated 320,000 people died and 1 million left homeless
  • Schools, businesses and homes were destroyed
Overall there was $9 billion dollars in aid given. However as you can see in the diagram very little of that money has reached communities and organizations, with only 0.6% of it going to Haitian organizations and 9.6% staying with the government. This is a good example of one of the main problems with aid, corruption.
On January 13th American Red Cross announced they had run out of supplies and started to appeal for public donations.
Initially the was piling up at the airport as the logistics were not in place, a common characteristic of an LEDC, water and food took days to arrive.
However some of the aid is now trickling through to the people as the Haitian government has helped over 50,000 people back into sub standard housing (50,000 out of 1 million is still not a lot!) Other improvements include river bank strengthening and tree planting along with rising school attendances. There is a new state of the art hospital that has contributed to the increased life expectancy in Haiti compared to 10 years ago. British red cross have given 26 local businesses loans of £9000 in order to kick start their businesses to try and boost the economy.
Overall the aid has not worked, this is shown in the house building project that spent far too much on houses and cut its goal of god standard houses from 15,000 to 2500 and only 900 have been built so far. it is very hard to track down where the aid has been spent as there is no transparency in the government.

An example of a top down scheme is the Akosombo Dam in Ghana.
A top down scheme is when money is given to a body who directs the money from the top. This strategy did not work as the dam was meant encourage new industries and stimulate agricultural growth however all it did was make 80,000 people homeless and not make enough energy in order to provide rural villages with energy.  It has also hindered transportations. However it has boosted fishing...

An example of a bottom up scheme is Farm Africa in Tanzania.
Tanzanian people mainly live in rural areas where food security is very low and improved and sustained agriculture is crucial for reducing poverty levels. This grassroots initiative worked closely with local communities. In partnership with the government they teach young children farming skills in order to share with their families and therefore improve productivity. They are also turning traditional activities such as honey making into a way to make money. This bottom up scheme has helped the people who need it and provided them with life long skills.

Sunday, 19 April 2015

Urban Regeneration - Gentrification + Notting Hill Case Study

Gentrification is the renewal of an area by wealthy individuals
It is common that wealthy people buy a house in an area and decide to do it up. Others do the same and then the area experiences a snowball effect.

Case Study - Notting Hill
During the 1950's Notting Hill was experiencing inner city deprivation, race riots and a high Afro Caribbean population.
During the last 30 years due to its ideal location in central London, wealthy business men have moved in and renovated houses on an individual scale. The movie Notting Hill helped raise popularity for the area.
Today the area is a fashionable places with very high house prices. It has one of the world's most famous markets 'Portabello market'. It is also home to the 2nd largest street festival behind Rio, 'Notting Hill carnival'. Many upmarket services have moved to the area so they can cater for the wealthy individuals who live there.
Effects of the gentrification include:


  • stabilisation of a declining community
  • reduced vacancy rates
  • an increase in property values
  • however there has been displacement of locals
  • also conflict and resentment between the old and new residents

Urban Regeneration - Partnership Schemes

Partnership schemes are between local and national governments and the private sector. City challenge, prestige/flagship projects and sustainable communities come under the bracket of partnership schemes.

City Challenge is an initiative where local authorities compete against each other in order to gain funding for the project. As opposed to other schemes CC focuses equally on buildings, people and values. Each different City challenge has slight different aims specific for the area, for example in Liverpool it was aimed at environmental improvement and in Hulme housing was the main focus.

Hulme City Challenge Partnership
In the 1960's many high rise flats were built in a slum clearance programme. These flats had poor design features and there was a high number of single person households. There was evidence that the local authority used the area to dump some of its unfortunate residents. Redevlopment occured in 1992 when the plans were drawn up. The redevlopment cost £37.5 million.

  • 3000 new homes were built
  • new shopping centres including an ASDA
  • new community facilities
  • improved infrastructure
As a result crime has been greatly reduced and there is a more cultural mix of people living in the area. A symbol of the regeneration is the Hulme Arch.

Prestige project developments
These include waterfront developments, for example those in Cardiff Bay. They involve the creation of innovative and stand out projects

Sustainable Communities
An initiative put in place by labour government in 2000. They are defined as places people want to work and live now and in the future. They are sensitive to the environment and contribute to a high quality of life. 


Urban Regeneration - Property Led Regeneration, London Docklands Case Study

Urban Regeneration is the recreation or improvement of an area experiencing urban decline.
The main types of urban regeneration are:

  • Property led regeneration - large scale investment programs ie. London Docklands
  • Partnership schemes (City Challenge) - Schemes between local and national government. (Imaginative local projects that aid regeneration bid against each other for funding from the government) 
  • flagship projects - a significant, high profile investment that will become a catalyst for regeneration
  • sustainable communities - places where people want to work and live now and in the future ie. BedZed, London
  • Gentrification - the process of which run down housing is done up by wealthy individuals and a snowball effect occurs.
Property Led Regeneration - London Docklands
Urban development corporations (UDCs) was a scheme set up in the 80's that would aid in regeneration. These huge scale schemes completely redevelop areas with the goal of lifting an area out of urban decline. They have power above the local authorities and focus on the physical, social and economic regeneration. An example of a UDC is the LDDC (London docklands development corporation) set up in 1981. 
During the 19th century the London Docklands was one of the busiest places in the world. It was home to one of the main ports. However by the end of the 1950's the area had seen massive levels of urban decline, this was due to:
  1. Increase in ship size meant they could no longer fit ships down the river Thames to the Isle Of Dogs.
  2. Containerization caused structural unemployment as fewer dockers were needed.
  3. Damage from the war
The area became derelict and run down, there was an increase in unemployment and there was a lack of public transport. By 1981 80% of people were living in poor quality housing and people were also leaving the area with on average a decline of 30% of the population.
In 1981 the LDDC was set up in order to reverse the decline and regenerate the area. It has resulted in major developments in and around canary wharf. They attracted £10 of private investment for every £1 they spent. The area became the first enterprise zone and overall there was £7.7 billion of private investment and that is still increasing. The regeneration has had many positive benefits that include:
  • Social - 120,000 new jobs created
  • Social - 8000 homes refurbished and 25,000 new homes
  • Social - New national indoor sports centre
  • Economic - Unemployment went from 14% to 7%
  • Economic - Canary Wharf is now one of main financial centres in the world and attracts lots of FDI
  • Environmental - 160,000 new trees planted
  • Environmental - network of pedestrian and cycle routes
Successes of the LDDC:
There was a clear increase in trade for the local shopkeepers as more people have job and therefore more people can spend on the economy, this boosts the local economy even more (multiplier effect). Lots of FDI from new buildings and projects. A wide range of benefits (see above).

However there have been criticisms of the developments:
  • many locals have been displaced and cannot afford to live in the area anymore
  • structural unemployment from the old dockers who are unable to work in skilled jobs
  • reduction in community spirit, tensions between newcomers and old eastenders.

Overall I think it is fair to say that the regeneration has been a success. 

Growth Of The BRICS

Brazil
Russia
India
China
South Africa?

Goldman Sachs economist Jim O'Neill predicted in 2003 the BRIC economies would, by 2050, be wealthier that most of the current major economic powerhouses. In 2012 South Africa joined therefore making the BRIC the BRICS. It is predicted that China and India will become the dominant forces in manufactured gods and services while Russia and Brazil will become the dominant suppliers of raw materials.
These 4 countries are the fastest growing and largest emerging market economies and account for just under half of the world's population. It is believed that China will become the biggest economy in the world sometime between 2030 and 2050 because as discussed in another post they have averaged 10% growth for the last 3 decades.

However they have experienced problems and are likely to run into problems in the future that include:

  • Russia face political problems which in turn will cause economic problems for example exports to Russia have fallen sharply, they also rely too heavily upon oil (we have seen lately the huge decline in oil prices that will have an effect on Russian economy)
  • India suffer from corruption and also an increasing current account deficit
  • Brazil's economic growth has plunged from 7.5% to 0.9% in 2010 to 2012. 
  • All growth figures and prospects will have been affected by the financial crisis

Goldman Sachs projected growth


The Globalization Of Services

Many refer to the globalization of services as the second wave of globalization.
Services include things like call centres, advertising companies, financial services etc.
Originally the offshore outsourced work were basic goods manufacturing tasks that were repetitive and uncomplicated, now with the globalization of services it is off-shoring more specialized tasks, not only call centres but examples include legal firms off shoring litigation and patent research.
In recent years the most popular destination for outsourcing services has been India, in particular the state of Karnataka where Bangalore is situated, it is referred to as India's 'silicon valley'. Behind India in the GSLI are other emerging countries such as china and malaysia. The GSLI ranks countries that are the best destinations for outsourcing goods to based on factors such as people skills and costs.

Case Study: INDIA - Karnataka

India is top of the GSLI, although the capital is New Delhi, it is Bangalore located in Karnataka that is the most important IT centre. There is a population of 8.4 million in Bangalore and is referred to as the 'silicon valley' of India. The service sectors contribution to GDP has increased from 15% in 1950 to over 50% now. India is a very attractive place to outsource services due to many factors:

  • 2nd largest English speaking population in the world
  • low cost but high quality and adaptable workforce
  • investment-friendly and supportive government policies
  • 3rd largest brain bank in the world - around 2.5 million technical professionals
  • well developed infrastructure and communications
Karnataka has historically been a place for technology and R&D based institutions. It was the first state to set up engineering colleges and a university of technology. Other things giving Bangalore a competitive advantage include:
  • Best telecoms infrastructure in country due to existing technlogy parks such as Myosore and Hubli. 
  • A specialized industrial park, Electronic City, has been built and spreads over 1.3 KM^2. 
  • technology universities
Bangalore has experienced growth of around 10% per annum and now has India's third highest GDP per capita. This is due to domestic investment such as the opening of an airport in 2008 but also the influx of FDI from countries such as HSBC, Google and Yahoo. 

However, despite its attractiveness India faces many future problems in maintaining its position. These include:
  • Competitions from cheaper places such as Vietnam and Phillipines
  • Wages are rising and so are other costs like rent, there is inflation
  • Many firms are moving call centres back to the UK due to customer complaints.


Thursday, 16 April 2015

Growth Of The Asian Tigers - Geography and Economics A-Level

The term Asian Tigers, refers to Taiwan, South Korea, Singapore an Hong Kong.

The term was becoming widely used in the 70s and 80s following the emergence of these four countries who all followed a similar pattern of development to becoming developed countries. These countries For example Singapore is now one of the world leading financial centres.

None of these countries had a rich supply of ntural resources. They followed a very export driven model of industrialization by focusing on selling to rich western countries such as the UK and USA. They decided that to boost the manufacturing industry they would have to tap in to economies of scale and therefore rely on international trade. In trading to a larger market they could improve efficiency through E.O.S. This model is different to conventional models of the time which involved imposing raised tariffs and quota on imports which reduced the number of imports and thus allowing the domestic industries to flourish and develop. Although the Asian Tigers did use this model at first before switching heavily to an export driven model.

These countries all had similar characteristics which included:
  • GDP growth rate from 1960 to 2000 averaged 6% per year 
  • abundance of cheap labour due to being poor in 1960
  • all invested heavily in education, this can increase LRAS and increase productivity
  • all had strong Chinese influences
  • non democratic political systems meaning plans were driven through easily
But is this a good model to follow?
There are many criticisms of this export led model which include:
  • dependency on other countries economic health can be very risky
  • fast expansion of these countries caused problems such as a in 1990 many stock markets crashed and sparked a worldwide financial crisis
  • Rapid industrialization has caused many environmental problems
  • Lost competitive edge to India and China who can now create at cheaper unit costs. 

The new era of  Asian Tigers (Tiger Cubs)

It is said that Indonesia, Malaysia, Philippines and Thailand are also following the export led growth model.
It is predicted that these 4 countries will be in the top 50 economies in the world by 2050.
Due to a high number of Chinese entrepreneurs and residents, the transformation of China has led to increased investment. 


Sustainable Tourism. Myth Or reality? - Geography A-Level

Sustainable tourism is defined as “tourism that respects both local people and the traveller, cultural heritage and the environment”. 
It is all about readapting the modern approaches to tourism. It involves tourism with a low impact on local culture and environment while creating jobs an income for the local area with the overall aim of conserving the local ecosystem.
Also commonly known as ecotourism.

Ways of creating sustainable tourism:

  • Using renewable energy ie. solar power for heating (environmental)
  • recycle rainwater (environmental)
  • only use sustainable materials, ie. wood from sustainable woods (environmental)
  • local food to reduce food miles (environmental)
  • promote local culture (social)
  • sell local products (social)
  • reinvest some profits into local community (social)
  • employ local residents (economic)
  • be locally owned and not be a TNC (economic)
  • only purchase local goods (economic)
Arguments against sustainable tourism:
  • Without proper management can be harmful to environment. ie. If there are no roads then can degrade the land
  • resentment of wealthy foreign visitors by locals leads to negative impact on local community
  • can make area dependent on tourism
  • when visitors increase then that equals more damage to environment
  • resorts usually in remote locations therefore more travel to get there.
Case Study: Galapagos Islands.

Ecuadorian islands 1000km off of South America. 
Most famous for site of Charles Darwins' 'thoery of evoluton' where he studied that finches had different beaks dependent on different islands.
Approximately 90% of island is designated as national park
Population of 20,000
Became first UNESCO heritage site in 1979
Around 100,000 visitors a year.


The tourists who visit have to abide by strict rules:
  • can only visit a limited number of places
  • are all educated on conserving land
  • pay £25 towards conservation of islands
Tourists generate a lot of business in area such as local guides, restaurants, hotels etc.

However due to growing demand for holidays there there are 5 flights a day that land on the islands and cruise ships stop off which harms the local marine life. There are still problems such as oil spills from boats, overuse of some sites (honeypot), and apart from tourism there are not many other employment opportunities. 

Monday, 13 April 2015

Boxing Day Tsunami Case Study - A2 Geography

Brief case study for plate tectonics unit 3 geography.

Background
  • 26th December 2004
  • 8.9 Richter scale earthquake in the Indian Ocean
  • A result of the Indo-Australian plate being subducted beneath the Eurasian plate
  • Waves reached 15m high in some places as they first reached the shore
  • Hit Indonesia first
  • Tsunami travelled at 800 Km/h
Impacts
  • 250,000 dead
  • 2 million homeless
  • Lost lots of benefits from tourism, loss of businesses, unemployment and lack of infrastructure.

Christchurch Earthquake A2 Geography - MEDC Case Study

Background Info

  • Located In New Zealand
  • On the Pacific ring of fire
  • Located on conservative plate margin a the Indo-Australian plate is moving past the Pacific plate.
  • Original quake was on 4th September 2010 and the most destructive quake was on 22nd February 2011
The Earthquake
  • 4th September earthquake measured 7.1 on richter scale and there were 361+ aftershocks in the first week
  • 22nd February earthquake measured 6.3 on richter scale
  • 22nd February had a very shallow focus of 5km deep
  • Christchurch is above sedimentary rock which is prone to liquefaction and shaking
Impacts

Social

  • 181 killed (80 from collapse of CTV tower)
  • 80% of the city without power
Economic
  • Increased unemployment
  • lost benefits of hosting rugby world cup
Environmental
  • Liquefaction
  • Earth rose 1cm and moved closer to Sydney
Responses
  • $6-7 million in aid
  • A plan was devised within 2 hours
  • Response centres were set up such as the Canterbury art gallery which is earthquake proof
  • Temporary housing provided
  • 6 months after the quake 80% of the roads had been repaired

Measuring Development - Development and Globalisation Geography unit 3 A2

There are many ways of measuring development, all have their positives and negatives.

GDP - Gross Domestic Product is the total output of an economy.

  • Does not take into account inequality
  • Nor informal employment
  • Very hard to measure with black markets etc.
GNP - Gross National Product is the GDP plus net income from domestic businesses abroad.
  • Same drawbacks to GDP
  • Doesn't take into account environmental, social development only assumes them
HDI - Human Development Index is an indicator that uses education (literacy rates), health (life expectancy) and living standards (GNP per capita)
  • Doesn't take into account environment
  • No indicator of distribution
  • Doesn't take into account corruption or political freedom
PQLI - physical quality of life index takes into account literacy rate, infant mortaty rate and life expectancy.
  • many factors ignored such as political freedom
  • economic growth/incomes
  • infrastructure
Others
  • HPI - happy planet index takes into account ecology, life expectanccy and life satisfaction
  • Life expectancy
  • Number of mobile phones per 1000 people
All indicators have their positives and negatives but the main problem with them is that they focus on certain aspects of development and not others therefore countries may not rank highly on one but rank highly on another. However the most common is HDI which has rankings, Norway are currently top with 0.944.